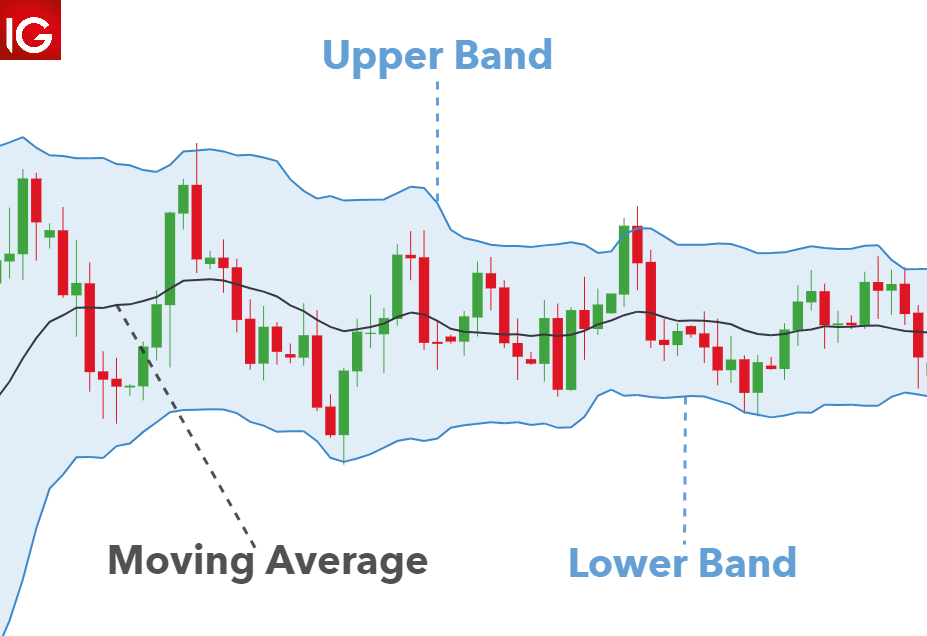
John Bollinger created the sort of price envelope known as Bollinger Bands. Prices forever round the top and lower price range levels. Bollinger Bands are envelopes that are drawn above and below a price’s simple moving average (…SMA is the middle band) at a certain standard deviation level.
Traders can use the bands to determine the direction of the market based on price movement. There are three bands used; one for the moving average, one for the lower level, and one for the upper level. Prices moving towards the upper band suggest that the market can be overbought when they do so and when the prices move towards the lower band, it suggest that the market is been oversold.

It is easy for you to implement the Bollinger band moving average approach if you understand a few points about it. The price crossing above the moving average’s middle line indicates a buy signal because it indicates an uptrend. If the price passes below the moving average, it is advisable to get out of the market.
Bollinger Bands: Utilizing Price Volatility for Trading Success
The Bands react and change shape when price fluctuations grow or decrease because they measure difference from the average. Increased instability in market movement is almost usually a hint that new norms will be established, and you can profit by employing Bollinger Band.
The default values for period and standard deviation are 20 and 2, respectively, but you can change them. Bollinger Bands are defined by two parameters: period (i.e. time frame) and standard deviation (Std Dev. It tells you, on average, how far each band value lies from the mean. A high standard deviation means that values are generally far from the mean, while a low standard deviation indicates that values are clustered close to the mean).
“Bollinger Bands: Usage and Limitations in Trading”
The Upper Bollinger Band is calculated by taking the Middle Band’s 20-day simple moving average and adding two standard deviations to that figure. Bollinger bands can help you evaluate whether prices are high or low in relation to one another.
Future prices cannot be predicted using these Bands. They can only react to uptrends or downtrends because they are based on a basic moving average. As a result, Bollinger Bands are a lagging indicator, Bollinger bands are often used alongside the Relative Strength Indicator (RSI) as well as the Bandwidth indicator.
What is the Bollinger Bands strategy formula?
In order to determine Bollinger Bands (at two standard deviations) using a 20-day simple moving average, use the following formula:
Upper band = (20-day SMA + (20-day SD multiplied by 2) 20-day.
Lower band: 20-day SMA – (20-day SD multiplied by 2).
Where: SMA means Simple Moving Average.
SD means Standard Deviation.
What exactly is the Bollinger squeeze?

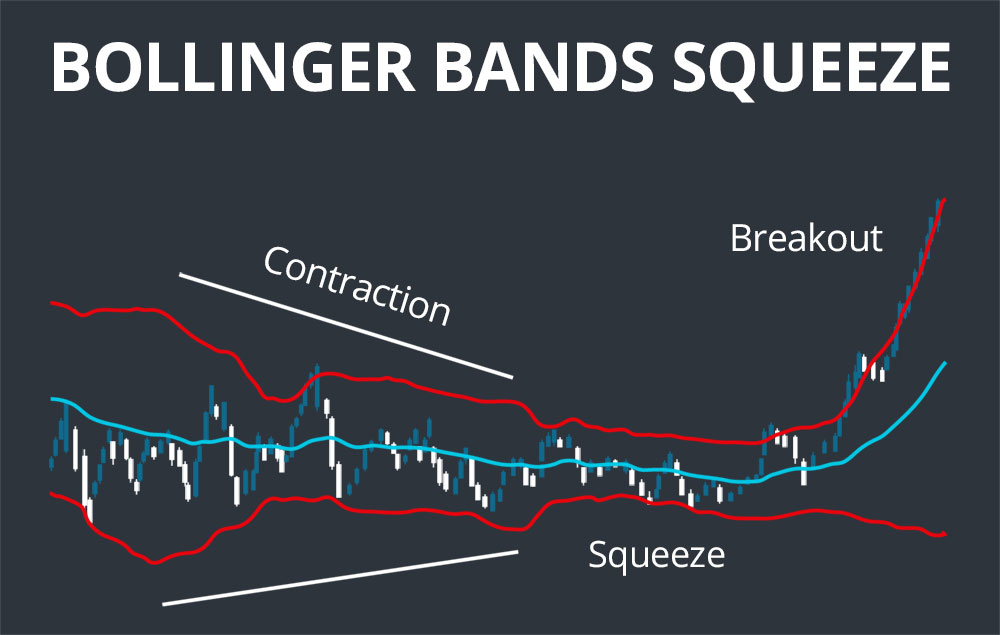
When instability falls to low levels and the Bollinger Bands narrow, the Bollinger Band Squeeze occurs. Periods of low volatility or instability, according to John Bollinger, are frequently followed by periods of high instability. As a result, a contraction or narrowing of the instable bands can signal a major gain or collapse.
Instability is high when the Bands are far apart. It is low when they are near together. A Squeeze occurs when instability reaches a six-month low and the Bands are at their smallest distance apart in six months.
What does the term “squeeze” signify in trading?
A short squeeze occurs when several people bet against a stock, causing its price to rise instead. A short squeeze causes a stock’s price to climb faster as short sellers exit to cut their losses.
Key points
- Bollinger bands are envelopes that expand and contrast according to the moving price.
- Bollinger squeeze is a long time effect of high volatility
- Bollinger squeeze can not be used to determine the future movement of the price movement.
- Bollinger bands are calculated by the Simple Moving Average over its Standard Deviation.
Like this:
Like Loading...
Related


0 Comments