Moving average convergence – Divergence are well-known indicator in finance for determining whether prices are rising or falling. People like to use it to check if anything, such as a stock or cryptocurrency, is gaining or losing value. It’s like having a specific compass for money that guides your steps through the financial world.
Convergence:
Convergence is the process by which the price of a futures contract, for example, starts to move closer to the price of the actual good you will receive (such as a tangible object or cash) as delivery time approaches. As the delivery date approaches, it appears as though the two prices are merging.

Divergence:
When the MACD Line and the price of the securities move in opposing directions, there is a divergence. Divergence that is bullish can indicate a potential upward turn, while divergence that is bearish can indicate a potential downward turn.
The MACD is calculated using the following steps:
a. Calculate the 12-period Exponential Moving Average (EMA) of a security’s closing prices.
EMA = (K x (C – P)) + P
Where:
C = Current Price, say $24.23
P = Previous periods EMA, say $23.92
K = the Exponential smoothing constant. Recall that K= 2÷(N+1)
The smoothing constant K, applies appropriate weight to the most recent price. It uses the number of periods specified in the moving average.
Solving for K first
K = 2÷(N+1)
= 2÷(12+1)
K = 2÷13
K = 0.1538 (4 d.p.)
EMA = (0.1538 x ($24.23 – $23.92)) + $23.92
= (0.1538 x $0.31) + $23.92
EMA = $0.0477 + $23.92
= $23.9677
EMA = $23.97 (2 d.p.)
b. Calculate the 26-period EMA of the same closing prices.
EMA = (K x (C – P)) + P
Where:
C = Current Price, assuming it to be $24.23
P = Previous periods EMA, say $23.92
K = the Exponential smoothing constant. Recall that K= 2÷(N+1)
Solving for K
K = 2÷(26 + 1)
= 2÷27
K = 0.0741
EMA = (0.0741 x ($24.23 – $23.92)) + $23.92
(0.0741 x $0.31) + $23.92
$0.023 + $23.92
$23.943
EMA = $23.94 (2 d.p.)
The smoothing constant K, applies appropriate weight to the most recent price. It uses the number of periods specified in the moving average.
c. Subtract the 26-period EMA from the 12-period EMA to get the MACD Line.
26-Period EMA = $23.94
12-Period EMA = $23.97
Subtracting: $23.97 – $23.94 = $0.03
.
d. Calculate a 9-period EMA of the MACD Line to create the Signal Line
EMA = (K x (C – P)) + P
Where:
C = Current Price, say $24.23
P = Previous periods EMA, say $23.92
K = the Exponential smoothing constant. Recall that K= 2÷(N+1)
The smoothing constant K, applies appropriate weight to the most recent price. It uses the number of periods specified in the moving average.
Solving for K
K = 2÷ (9+1)
= 2÷10
K = 0.2
EMA = (0.2 x ($24.23 – $23.92)) + $23.92
= (0.2 x $0.31) + $23.92
= $0.062 + $23.92
EMA = $23.98
e. Optionally, calculate the MACD histogram, which is the difference between the MACD line and the signal line.
MACD Line: Represents the short-term momentum and the difference between the 12-period and 26-period EMAs.
Signal Line: A 9-period EMA of the MACD Line that smooths out the MACD Line.
The MACD histogram: A graphic representation of the divergence and convergence of the MACD Line and the Signal Line.
EMA of 9-period single line of MACD = ((CP – P9p) x K + P9p)
(($24.23 – $23.98) x 0.2 + $23.98)
($0.25 x 0.2 + $23.98)
($0.05 + $23.98)
= $24.03
Where
CP = ClosePrice Current Bar
P9p = previous 9-period EMA of MACD
K = Smoothing constant, i.e. 2÷(N+1)
MACD Line = $0.03
Signal line: $24.03
Difference = $0.03 – $24.03 = $-24
Interpretation:
Signal line compared. the MACD line:
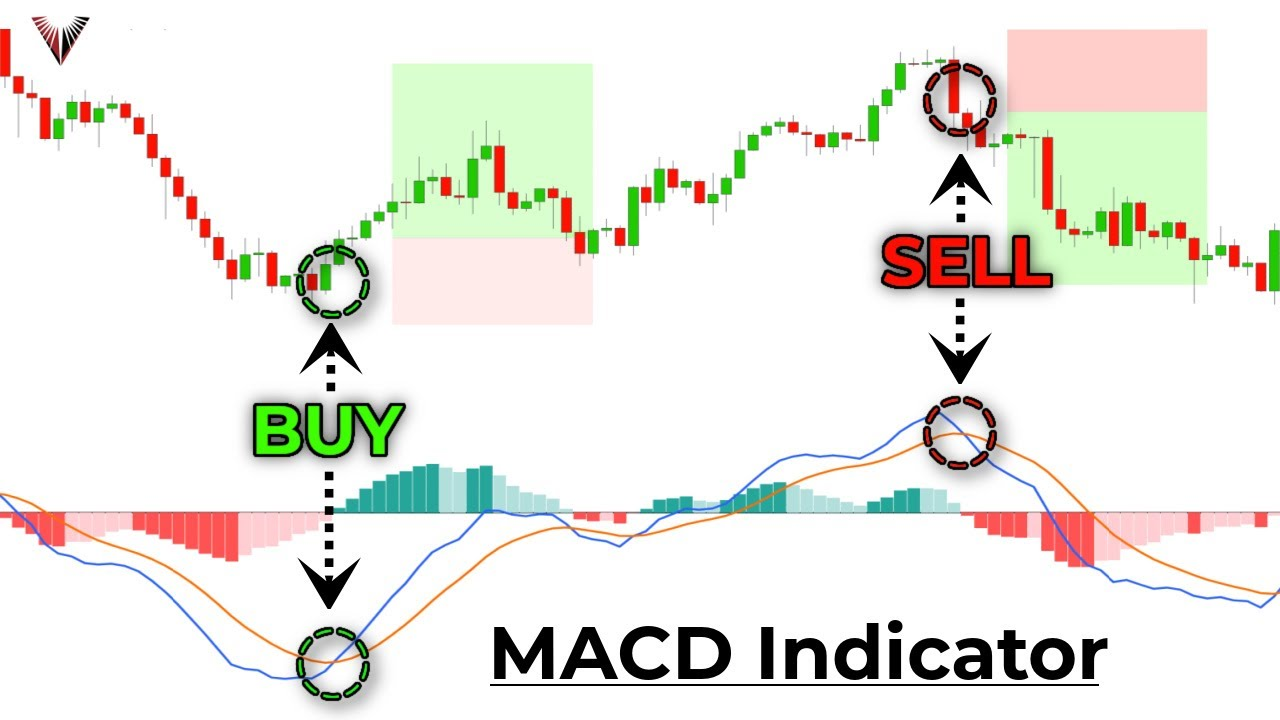
A potential buy signal is created when the MACD Line crosses over the Signal Line.
A potential sell signal is created when the MACD Line descends below the Signal Line.
Histogram:
Bullish momentum is indicated by positive histogram values (MACD Line above Signal Line).

The strength of the trend is shown by the height of the histogram bars
Uses:
Trend identification: MACD aids traders in determining a trend’s strength and direction.
Signal generation: Buy and sell signals are produced by crossing over the MACD Line and the Signal line.
Divergence: A divergence between the MACD and price may indicate that a trend is about to change.
Trading professionals use the histogram to detect changes in momentum.
Timeframe: Depending on the objectives of the trader or investor, the MACD can be applied to a range of periods, including intraday charts and charts with a longer time horizon.
Strengths:
Simple to understand and use.
Can be effective in trending markets.
Provides clear buy and sell signals when used with other indicators.
Limitations:
In unstable or sideways markets, it could produce invalid indications.
Slow indicator: It might not offer immediate notifications for quickly changing markets.
Relies on previous pricing data and cannot take all market dynamics into consideration.
MACD Variations: To fit their own trading styles and choices, traders and analysts frequently alter the MACD settings (such as the EMAs or timeframes) that are used.
Like this:
Like Loading...
Related


0 Comments