SEO, SEM, & SMM in Digital Marketing
SEO is referred to...
SEO is referred to...
DIGITAL MARKETING...
In a historic leap towards a brighter future, Nigeria has taken a monumental stride by releasing its National Blockchain Policy and inaugurated a 29-member implementation and steering committee.
Proof-of-stake uses validators to confirm crypto transactions efficiently and securely.
AI has greatly benefited me as a designer. It automates repetitive tasks, gives me precise insights based on data, and enables me to make informed decisions.

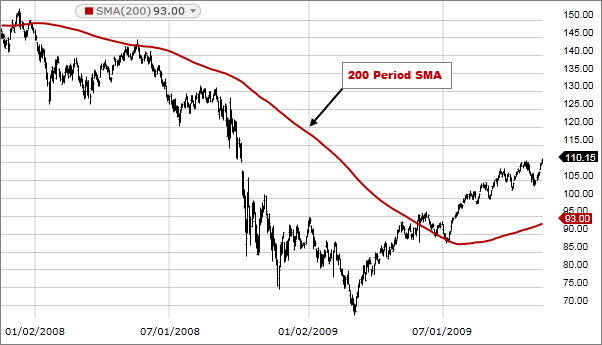
Moving Averages are like the trend detectives of technical analysis.
A simple moving average (SMA) is a straightforward method for calculating the average price of something. You do this by adding up the most recent prices and then dividing that total by the number of prices you added.
If you’re familiar with finding the average of numbers, you can easily understand the Simple Moving Average (SMA). Among various moving averages, the SMA is the easiest to work with because it’s pretty straightforward.
Imagine you’re interested in the average price of something over a specific period of time, like a week or a month. You can also think of it as figuring out the average of a selected set of prices. It’s called a “Simple Moving Average” because it creates a line on a chart that moves as the average value changes.
In finance, like when dealing with stocks or cryptocurrencies,SMA is quite useful.. It helps us determine whether the prices are generally going up or down over a particular period. So, it’s like having a quick way to see the trend in prices.
SMA=A1+A2+…+An
n
where:
An=the price of an asset at period n
n=the number of total periods.
Using a simple analogy with oranges. 15, 12, 10, 7 and 26 oranges were sold over a period of 5 days. Find the simple selling (moving) average.
This would be: 15+12+10+7+26
5 =70/5 = 14 SMA.
So, SMA is like a tool that helps you see the big picture of how prices are moving. If it’s going up, things are looking good, and if it’s going down, it might be a bit worrisome. But remember, it’s just one tool among many that people use to understand how prices are changing and make decisions about buying and selling stuff.
Imagine you’re checking out the weather forecast to decide whether to bring an umbrella or not. You notice something interesting: two lines that show how the temperature has been changing over time. Now, these lines are like the “weather trend” lines for prices in the stock market.
When the short line (let’s call it the “short-term line”) goes above the long line (the “long-term line”), it’s like a signal that says, “Hey, good times might be coming!” We call this the “golden cross.” It’s a sign that the prices might go up. But if the short line drops below the long line, it’s a different story. This is called the “death cross,” and it’s like a warning that prices could go down.
So, when you see a golden cross, it’s like getting a thumbs-up to think about buying something because the prices might go up soon. But if you spot a death cross, it’s a bit of a red flag, suggesting that prices might be heading down, so you might want to think twice before buying.
Keep an eye on how many people are buying and selling (kind of like how many people are talking about the weather). If lots of people are trading when the lines cross and it’s a golden cross, it’s like the weatherman saying, “Hey, really sunny days might be ahead!” And if it’s a death cross with lots of trading, it’s a hint that there could be more cloudy days in the market.
In a nutshell, these lines, or moving averages, crossing each other give you clues about what’s happening in the stock market. A golden cross suggests brighter times, while a death cross might mean a bit of a storm ahead. Just remember, these signals are like weather forecasts – they’re really helpful, but it’s smart to consider other things too before making big decisions.
Think of SMAs like road signs that help you drive safely in the stock market. They give you hints about what might happen next.
SMAs can act like the cushions on a trampoline. When the stock’s price hits a certain line (SMA), it might bounce back up (support) or bounce back down (resistance). It’s like a line where the stock goes, “Whoa, I’m not going any further!”
SMAs also help with timing your actions. Imagine you’re learning to ride a bike. At first, you might want to go slow and steady, right? Longer SMAs do that – they smooth out the bumps and help you avoid quick changes. As you get better, you can start going faster, like using shorter-term SMAs.
Just like you learn to ride slowly, in the beginning, it’s smart to start with longer SMAs. They help you avoid sudden big losses. As you get the hang of it, you can try shorter SMAs for quicker trades.
Remember, trading with SMAs is like following a map. But sometimes, the map doesn’t show everything. So, you can adjust your moves along the way. If things seem good, you might add more to your trade. If not, you can pull back a bit. It’s like changing your bike speed based on the road ahead.
So, SMAs are like helping hands that tell you where the stock might go next and when to speed up or slow down. Just remember, it’s like learning to ride – practice and patience make it work best!
Imagine you’re trying to predict the weather, but you can only use information from yesterday and the days before. You want to know if it’s going to rain today, but the weather can change quickly, right? That’s a bit like how the Simple Moving Average (SMA) works.
The SMA looks at the average of something, like stock prices, over a certain time. It’s helpful to see trends, but sometimes it uses old information that might not be very accurate for what’s happening right now. It’s as if you’re making predictions based on old weather reports, even though the weather has changed.
Some traders prefer to use newer data because it’s more up-to-date, like the latest weather forecasts. They think it gives a clearer picture of what’s happening at the moment. While the SMA is useful, it might not always show the most current trend since it considers older information too.
While SMA is helpful, it can be a bit slow to catch sudden changes because it treats all prices the same way. There are other types of moving averages that react faster to quick shifts, but they involve more complex math.


0 Comments